
Chapter 2: The Shopping Funnel
HOW TO OPTIMISE PRODUCT DISCOVERY OF YOUR OFFER
The workhorse of your site is your Product Listing Pages (PLPs). They present your product offer and sort it for the customer through your category tree. Depending on your site platform or any 3rd party tools your site may also use, the order in which your products appear in a PLP can be data-based in an algorithm or manually sorted by business users. An algorithm that sorts your product will do most of the heavy lifting across your site. A manual sort of products will enable you to curate multiple brands or categories in an almost editorial way to inspire customers and ensure you can override rankings when a data-based solution may not be your best option.
PLP TYPES
By nature, a PLP is a collection of products based on a common attribute. What that common attribute is can be totally up to you, but there are some standard PLP types most businesses use:
Product category
This aligns to your Category Tree, and will include products of the same category. Often this has multiple layers, so that a customer can drill down into a more granular type of product from Level 1 (L1) to 2, 3 etc. This will make up the majority of your top navigation for your store.Product brand
This will show all products under a certain brand, so that if customers want to explore an offer that way it’s available to them. A common pathway into these PLPs is by clicking on the brand in a product’s PLP, but you can also serve a holistic brand list in your navigation.New arrivals
Depending on what you sell, there may be a customer appetite to see what is new in your offer. That means that this page can be an assortment of brands and categories, so it can take some curation to order it in a way that inspires and engages a customer.Sale products
When you are on promotion for your store, you can replicate your category PLPs for just those on markdown. This gives customers an easy way to shop your sale, but also can act as a key CTA for your marketing activity. Depending on how your site works, you could choose to remove sale products from the rest of the site and only host them here.Manual curation
This type of page is often born out of either customer need or marketing campaigns, but there is certainly a place for edits of your product offer that don’t necessarily fit into any of the other PLP types. This could include birthday gift ideas, what your children might love for summer in the garden, or all the ingredients you’ll need to make chocolate chip cookies. As they fall outside the standard set, focus on how you’ll drive traffic into them.
PLPs also tend to be structured in a way that is familiar to users, with user controls like sorts and filters as well as supporting content like a header and even content injected through the rows of products. It’s critical that this structure is responsive to devices as a majority of users browse on their phone so though we all try to optimise on our computers at work, it should always be sense-checked on a mobile as that is how most of your customers will experience it.
SAMPLE PRODUCT LISTING PAGE

PLP PERFORMANCE
Measuring PLPs can be approached a few ways, and with the mid-funnel, your main goal is to determine if users are discovering products seamlessly and then do those products go on to be purchased. You will likely find that the metrics vary by PLP type as users may shop in a slightly different way… Do they browse more when shopping by new arrivals? Do they use a lot of filters when shopping by category?
To circle back to our product relative metrics as well as events from Chapter 1, the key performance indicators on PLPs are:
PLP Usage
Browse
PLP CTR
Usage of filters and sort bys
Pagination rates
PLP Usage is a benchmark for this part of your shopping funnel, and should be tracked for variances but not necessarily something you are driving change in on a weekly basis. Typical rates would be around 30%, meaning 30% of sessions view a PLP when they visit your site (session). There are multiple ways in which a customer can enter a PLP, and though the assumption is that it is organically through your home page, your emails or your navigation, the culprit that can really drive this up is through Paid and Organic search. Perhaps users don’t search generic terms in Google as much anymore, but it is still a key traffic driver that should be optimised.
Product discovery can be measured through browse, where you can track how many products a customer views in a given listing. This will show you their appetite for inspiration as well as whether they are shopping for a particular need.
PLP CTR can be thought of as the conversion of PLPs… the efficiency metric that tells you if you are showing customers the right products. As CTR takes clicks relative to views, it means that pages where a customer browses more (views more products) could see CTR diluted. This is not a cause for concern, but just something to be aware of in how it’s calculated.
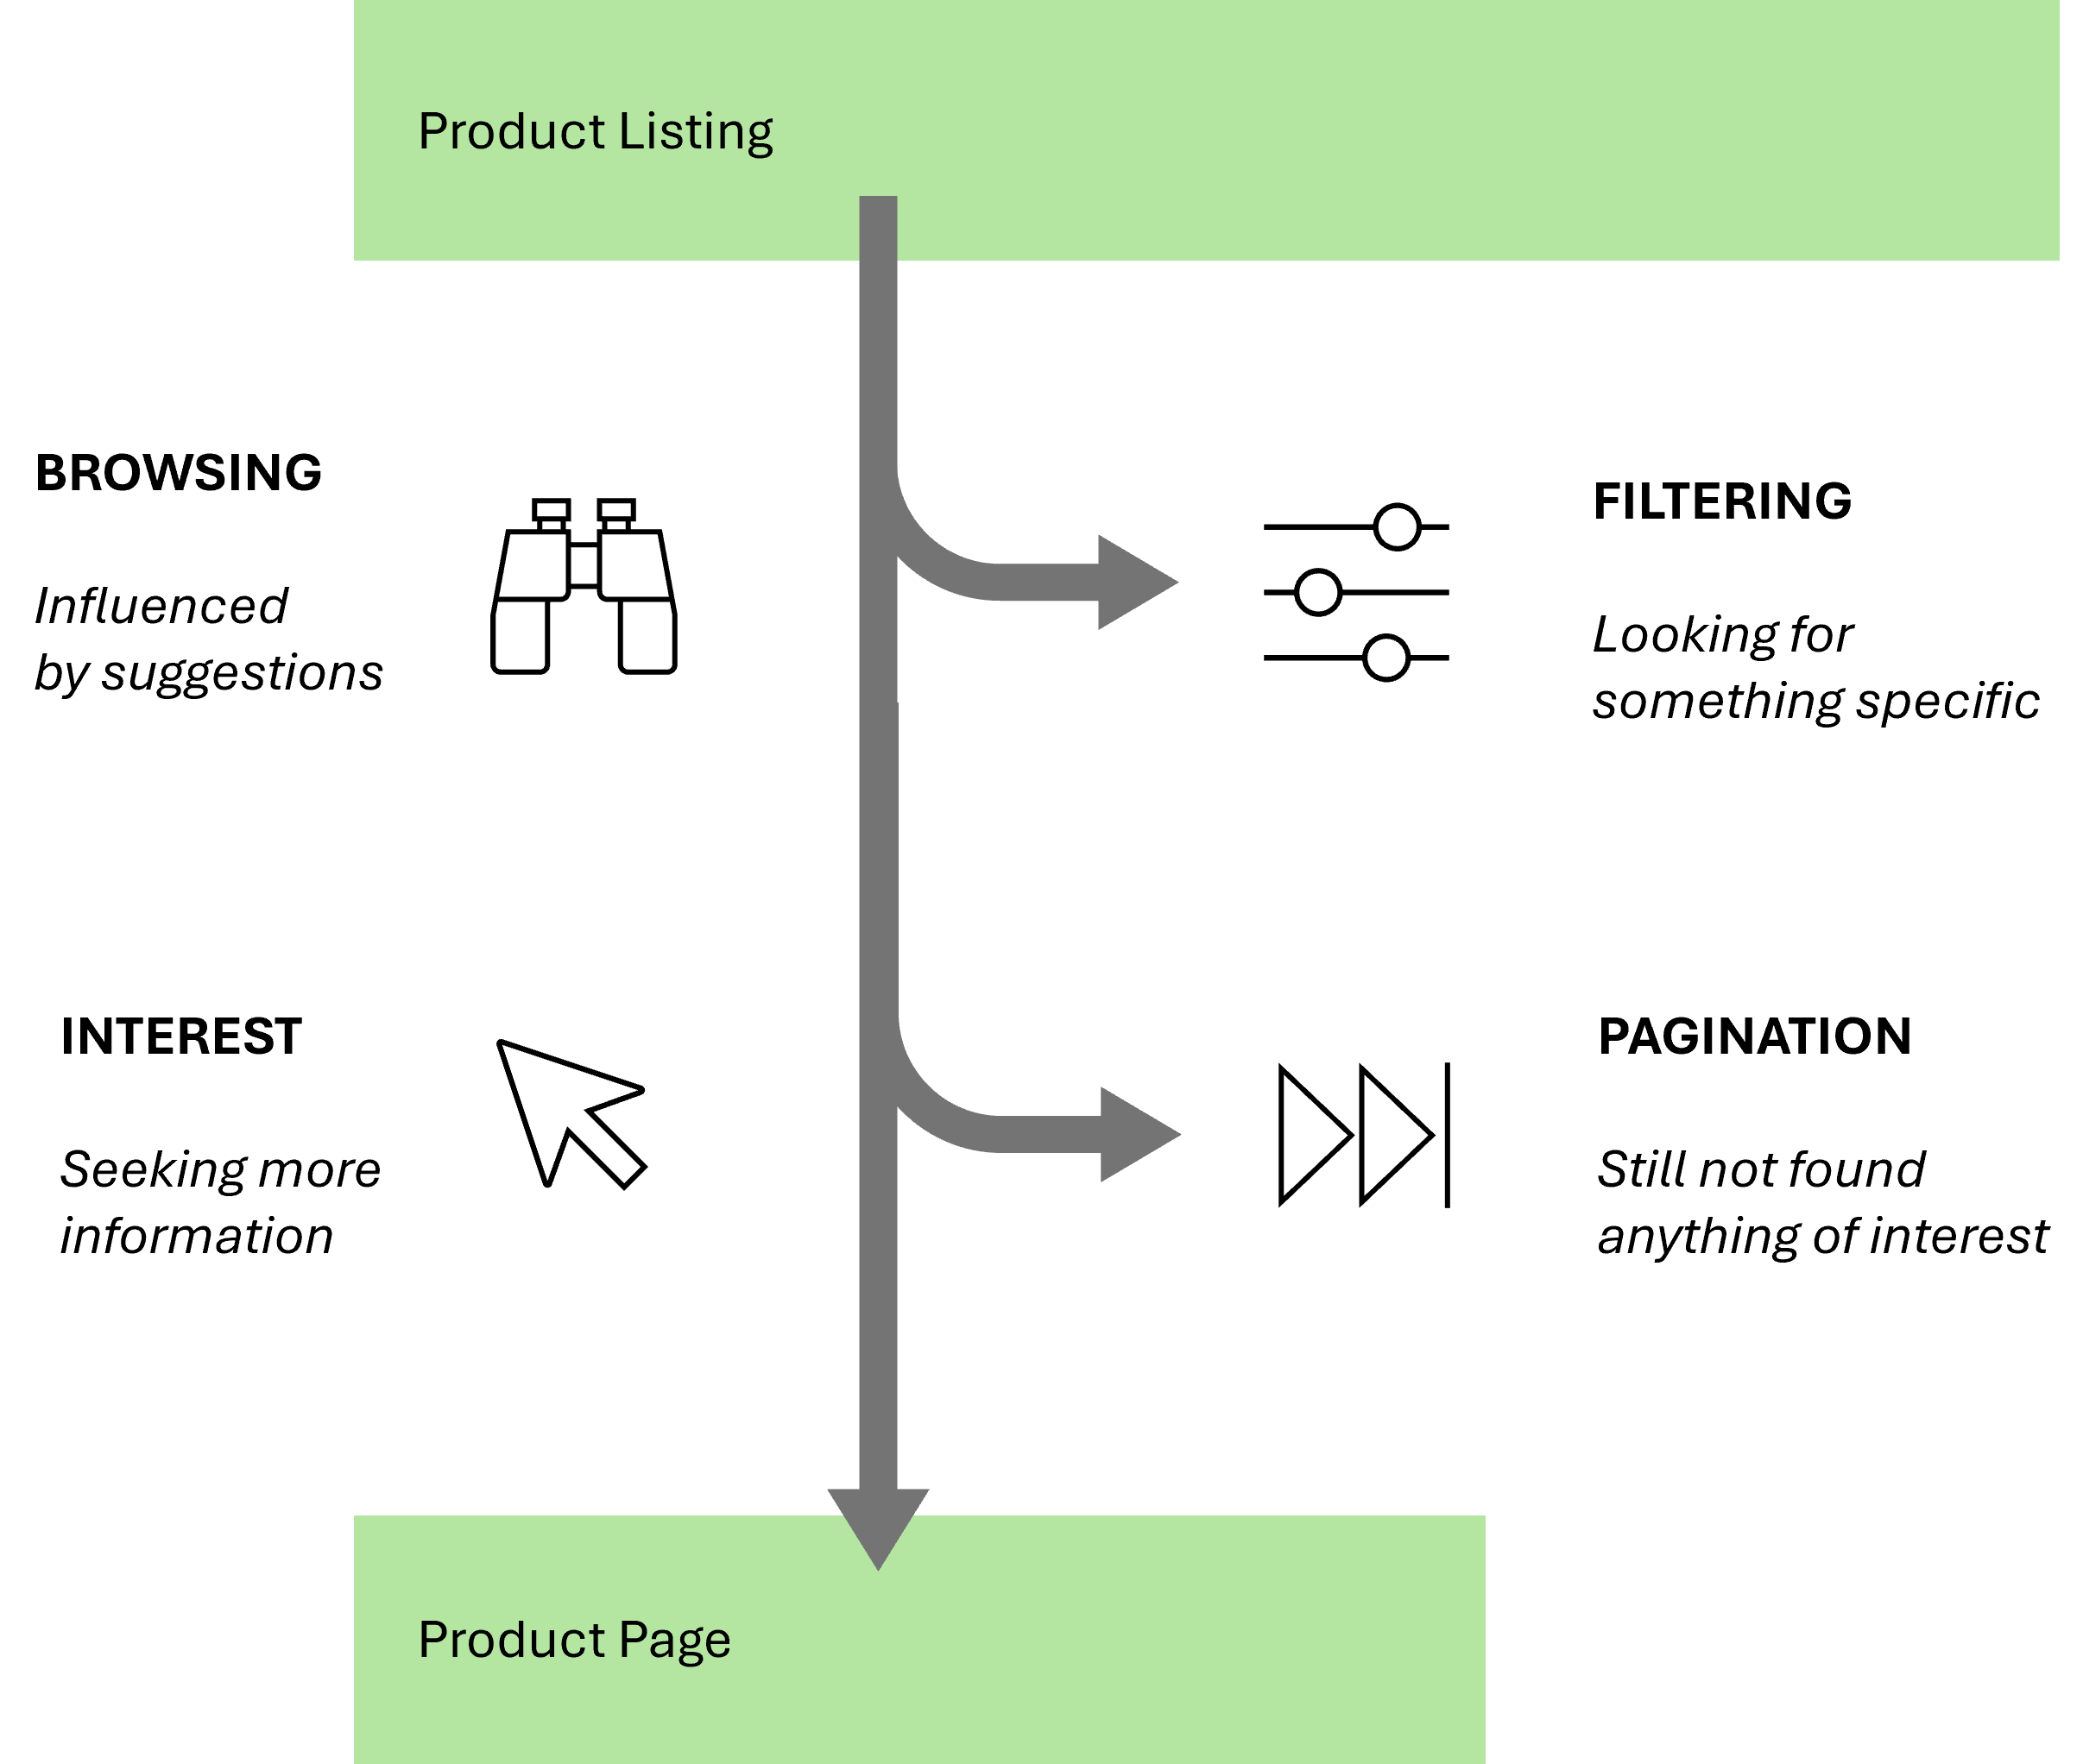
In the below chart you will see some key user perspectives, which can be identified through their actions in the PLPs. The main measure of PLP success is progress onwards to PDPs in the shopping funnel, whether through being influenced in browse or filtering down to something specific.
BROWSE & ENGAGEMENT MAPPING
In the below graph you will see Exposure and PLP CTR mapped against each other for various PLPs. What this is telling you is how users shop on different PLPs, and how this should inform where you prioritise manual merchandising vs algorithm. Each quadrant can be interpreted with a relevant action:
High browse & low engagement
INSIGHT > Users enjoy being inspired and view more products in a session, but they might not be sure what they want and need more consideration to make a purchase.
ACTION > Curate the offer to highlight your top products, but also consider integrated content to send customers to other pages and extend their session.High browse & high engagement
INSIGHT > Users like to be inspired and are influenced by what products you put in front of them.
ACTION > Curate the offer to make purchasing easy and link adjacent product categories to maximise basket size.Low browse & low engagement
INSIGHT > Users have a need but are not finding what they are looking for.
ACTION > Do not focus on manual merchandising, instead optimise your algorithm to improve the offer.Low browse & high engagement
INSIGHT > Users know exactly what they are looking for and are finding it on the page.
ACTION > Put your bestselling products first and turn your attention towards additional supporting actions like filters to support the user’s need for urgency and efficiency.

Supporting events like the usage of filters and sort by can also give signals about your customer shopping behaviour. If, for instance, your customers have high filter engagement but when you look into the granular data it is heavily weighted in colour filters, you could tailor your offer to include more products like that. If usage is low and you want to increase it, then look at the options you offer and the overall UX of the design.
As you will find in a lot of your analytics across site, the data will be something you can access and then when you string them together you can infer what they mean. For more tips on how to turn these data points into an insight about customer behaviour, refer to Distilling Data.
LESSON SUMMARY
PLPs are your core product discovery tool and the beginning of the mid-funnel
PLPs can be grouped into types based on their common product attribute or customer need to better understand shopping behaviour
Strike a balance of data driven solutions and brand led curation to optimise how products are sorted, ensuring you maximise both browse and engagement metrics